
The Truth About Inflation

In the last few years, we have all experienced and felt an increase in cost of living, higher inflation, and a destruction of our purchasing power. Wages which don’t keep pace with our added costs. While the average citizen has lower real wages and less money at the end of the month, the rich are getting richer driving the Income inequality gap.
This document aims to demystify why this is happening going back to first principles in the following format:
- What is inflation?
- How is inflation calculated?
- How is inflation represented in the media and political circles?
- What drives inflation?
- Who benefits from Rising prices and why?
- What are the implications of high inflation on people:
- What can we do to protect ourselves?
Once we can answer these questions, we will be better placed to find solutions to protecting ourselves from inflation and debasement.
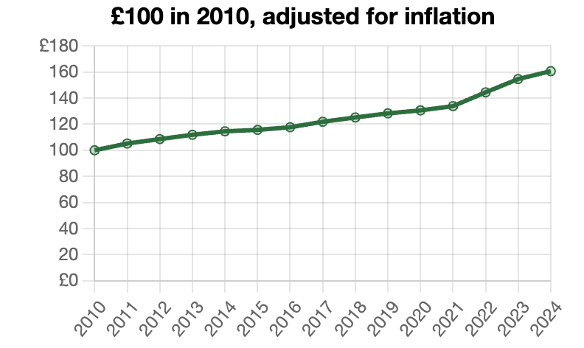
£100 in 2010 is worth £160.69 today
Setting the scene: To achieve the same purchasing power of £100 from 2010 (the year I started working) you would need £160.69 today to buy the equivalent amount of things.
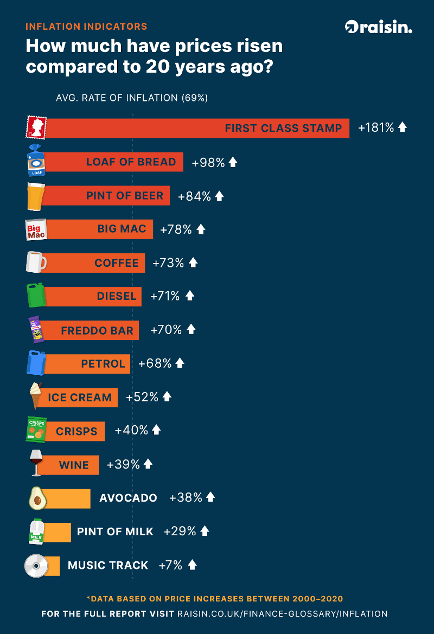
How much have prices risen vs 20 years ago?
What is inflation?
- Inflation is a measure which aims to estimate the increase in prices over time
- Inflation is also a measure of how much your purchasing power is decreasing over a set amount of time.
If a typical weekly basket of goods cost you £200 and that rose to £220 over 1 year then you have experienced 10% inflation but also a 10% deterioration of your purchasing power assuming your wages did not rise.
- It is expressed as a rate of change in prices rather than an absolute index of prices.
- Shrinkflation is a new phenomenon where you receive a reduction in quantity of the product while price stays the same – a simple trick to make us believe that prices are stable: Ever noticed how your bag of crisps is now much smaller?
How is inflation calculated
The Consumer price index (CPI) is one of the most popular measures of inflation. The number is generally measure on a Year over Year basis. It is a rate of change number rather than a number that gives you any information about past data (beyond 1 year)
- The Consumer Price Index measures the overall change in consumer prices based on a representative basket of goods and services over time.
- Central Banks in the UK and US and other developed nations target 2% annual inflation as a sign of a healthy economy.
The CPI basket is mostly kept constant over time for consistency but is tweaked occasionally to reflect changing consumption patterns—for example, to include new hi-tech goods and to replace items no longer widely purchased.
NOTE - the basket can also be altered to “hide” inflation in an economy over time. For example, house prices and the costs of borrowing used to be part of the CPI calculation, but when these prices rose too fast the authorities replaced house prices with rentals.
Why do we need a positive Inflation target?
- If prices are predicted to fall then the theory states that consumers will delay purchases and thus lead to lower overall demand in an economy – this is the widely held Keynesian Economic view which economic policies are derived from. Rising prices at a steady pace drives spending and consumption and reduces incentives to save.
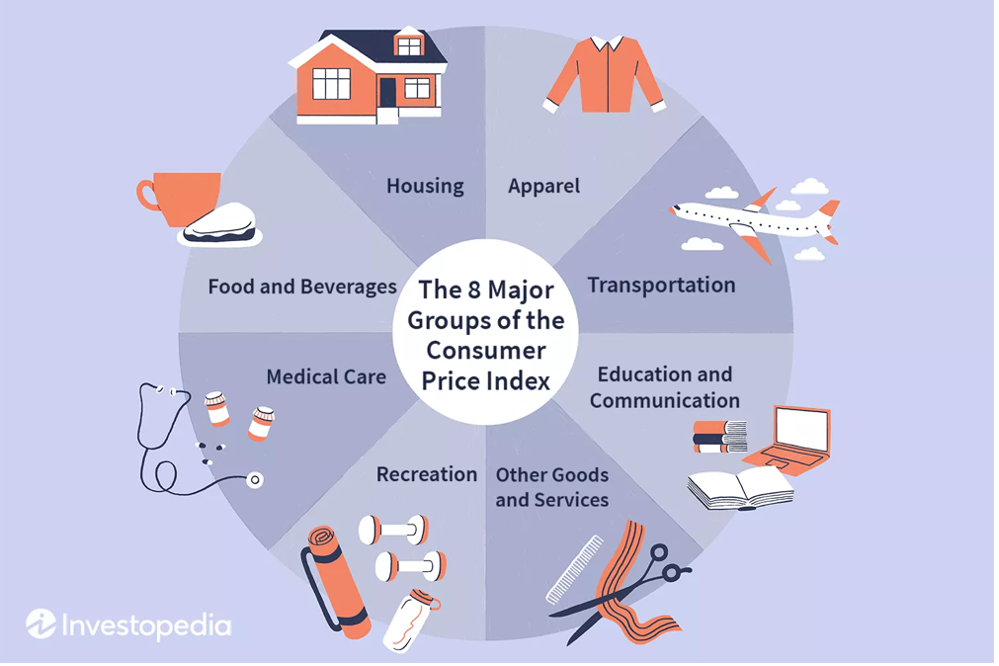
The subgroups within CPI :
How you show Inflation in a chart / data is Very Important:
- Inflation is a measure showing the rate of change in prices over a one year period, how it is expressed is crucial.
- Falling inflation DOES NOT mean things are getting cheaper, rather they are just getting expensive less quickly!
- Only when you have a Negative inflation number are things getting cheaper.
This is an extremely rare scenario – since 1990 this only happened once in the UK very briefly in 2015 when UK CPI hit -0.1%, so basically flat prices rather than a reduction
Putting Inflation into context of past inflation is important to give a true picture of the underlying forces
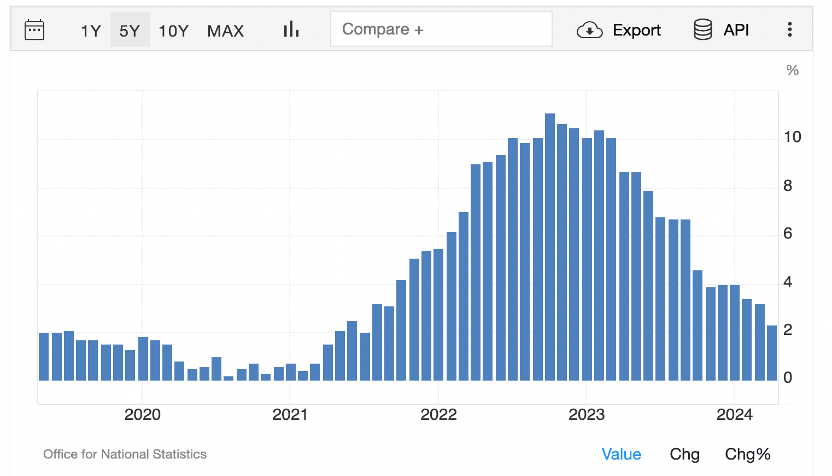
The following 2 charts show this in action:
This is the Monthly CPI inflation YoY rate over the last 5 years, The rate of inflation is slowing – a sign that prices are “stabilising”. As we discussed this means that things are getting more expensive LESS QUICKLY. Not a reason to celebrate if wages are not keeping pace!
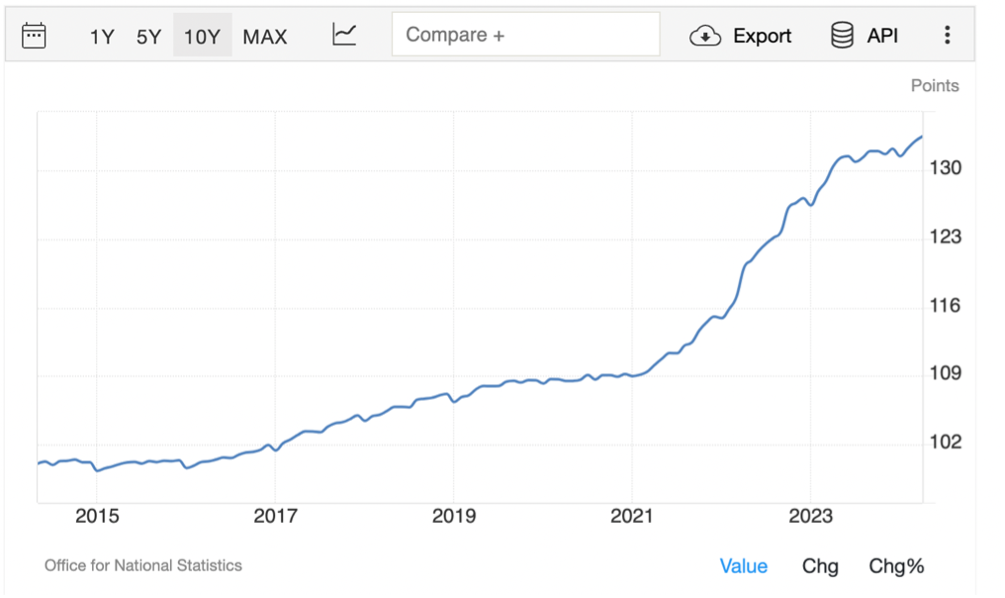
The Index of prices below shows that your basket of goods is now almost 30% more expensive than 2021 – but the rate of increase has slowed (YoY inflation is now 2% - so the chart has slowed in its ascent)
- This slowing in the rate of increase in prices is the reason they can claim that inflation has slowed and back closer to the target.
- Do we ignore the prior 2 years of rapid increases with no equivalent increases in wages?
This next chart shows how our purchasing power has reduced significantly over the last few years by graphing the inflation rate as a continuous price level.
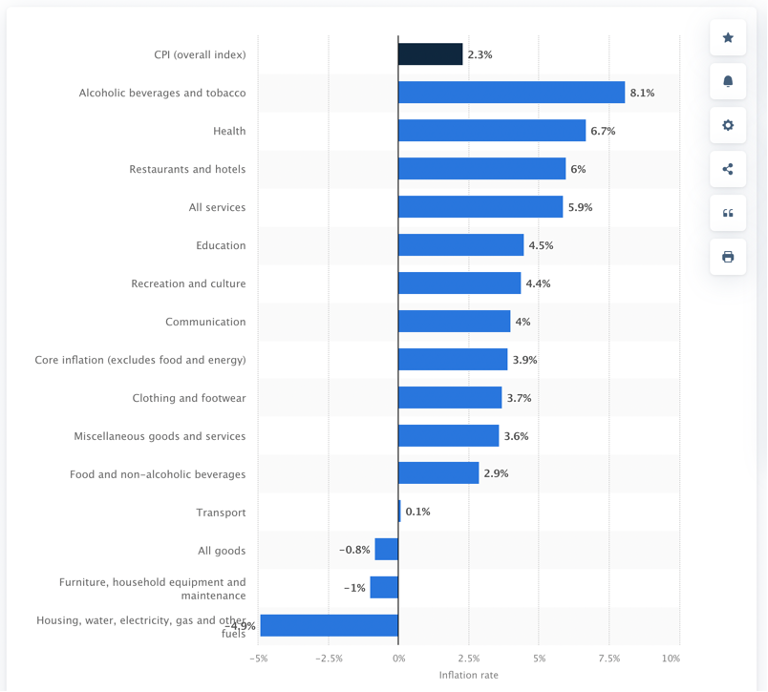
Where is the inflation coming from:
Because CPI covers a broad basket of goods where the inflation is coming from is a key factor in determining how this impact households, thus each household will have a different true rate of inflation based on their purchases:
Inflation rate for the Consumer Price Index (CPI) in the United Kingdom in April 2024, by sector
How does the media report inflation?
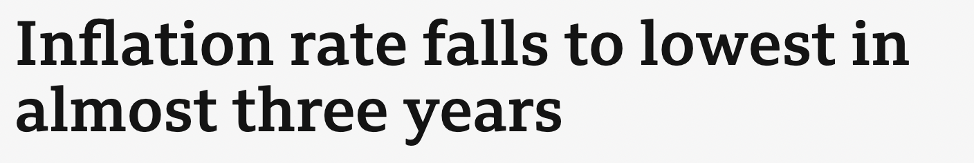
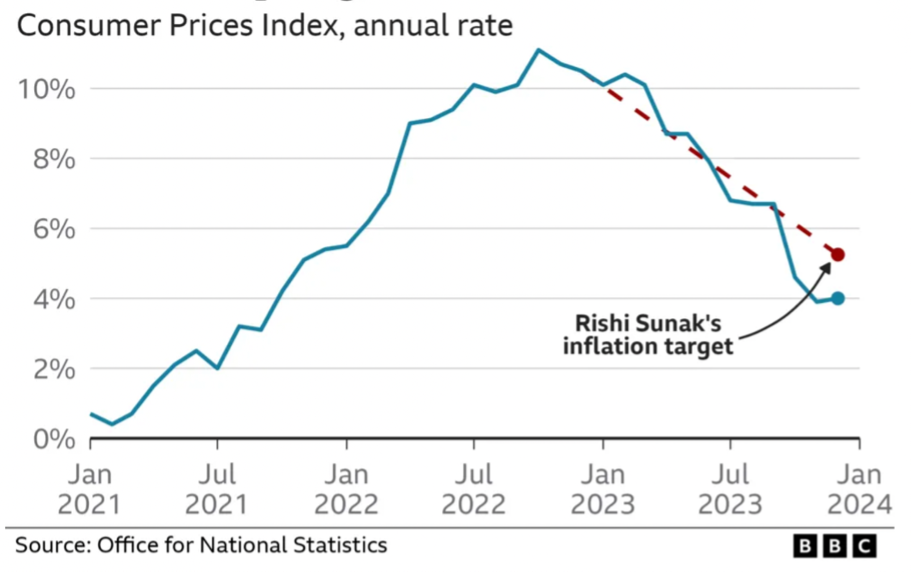
This headline from May 2024 at the April 2024 release of inflation suggests a positive outcome ... but what’s going on ... are things getting cheaper??
- The April 2023 Monthly inflation number was 1.1% which is approximately 13% annualised (6x as large as the Bank Of England Target)
- Because this data print from last year is about to fall out of the yearly lookback it appears that inflation is falling quickly – but this is misleading from the reality as we explained in the prior charts.
Once the overall price level has risen the next inflation number is taken from the higher price level meaning that the effect is exponential.
Rishi Sunak in fact made it one of his key pledges to halve inflation in 2023 – but halving YoY inflation from 10% ->5% was in reality not much of a win more a technical factor that was always going to happen. The new price level was already set we just didn't continue to rise as fast.
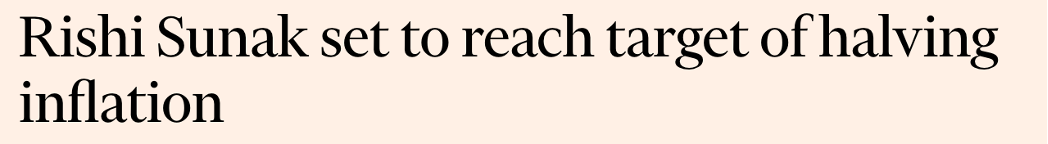
Pledge to half inflation fulfilled – but have your incomes risen by as much as the constant high inflation we have experienced. Is there then any reason to celebrate when YoY inflation goes back towards the 2% target ?
What drives inflation:
1) Money supply growth – The biggest driver of inflation is the total amount of a currency in existence- this is a topic we will cover in more detail in future publications:
- If the total money supply in a country increases it will by default lead to an increase in prices albeit with a slight lag effect. This is called monetary debasement and is often called a stealth tax on people.
- By increasing the total amount of pounds in the system the pounds that you hold become less valuable by an equivalent percentage.
- This is simple supply and demand – increasing the supply of a good will lower its value. This leads to a reduction in our purchasing power.
- Real assets however tend to outperform inflation as the new influx of money doesn’t fully trickle down the economy and will end up in assets such as property & stocks which drive wider the income inequality.
2) Demand / supply side factors:
Higher demand for a product will drive prices for that product higher
Supply side issues can drive prices higher – we experienced some of this with the supply of energy and food at the start of the Russia/Ukraine war.
- Often governments will impose tariffs to increase the frictions in trade and to protect local industries- the US is currently looking to impose tariffs on Chinese tech which will raise prices of these goods in the USA.
- This inflationary theme could be exacerbated under a Trump Presidency
Structurally and looking forward, inflation is likely to be a more persistent problem than it has been in the past due to the latest trends of deglobalisation, energy transition, restrictions on immigration, increased fiscal spending and defence spending
Who benefits from Rising prices and why?
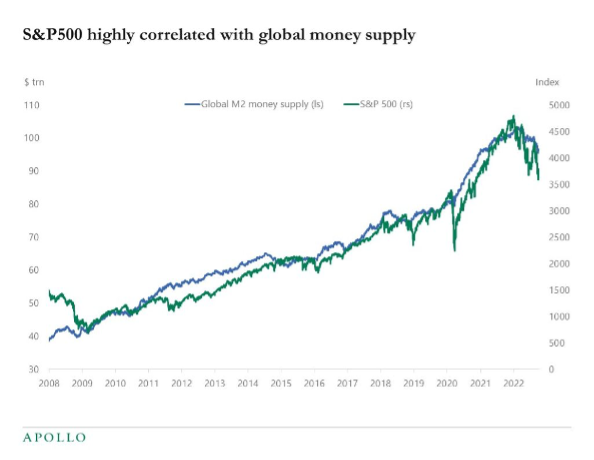
We discussed how real assets rise when money supply / inflation is high. Thus those who are invested in real assets are able to protect their wealth from devaluation and a loss in purchasing power. This tends to be the richest in society who hold the most assets and investments.
This chart shows the correlation of the US stock market(green line) to total $ money supply(blue line)
This is why investing and saving as much as we earlier in life can help us build wealth over time and protect ourselves from devaluation (refer to section on compounding in the pensions document)
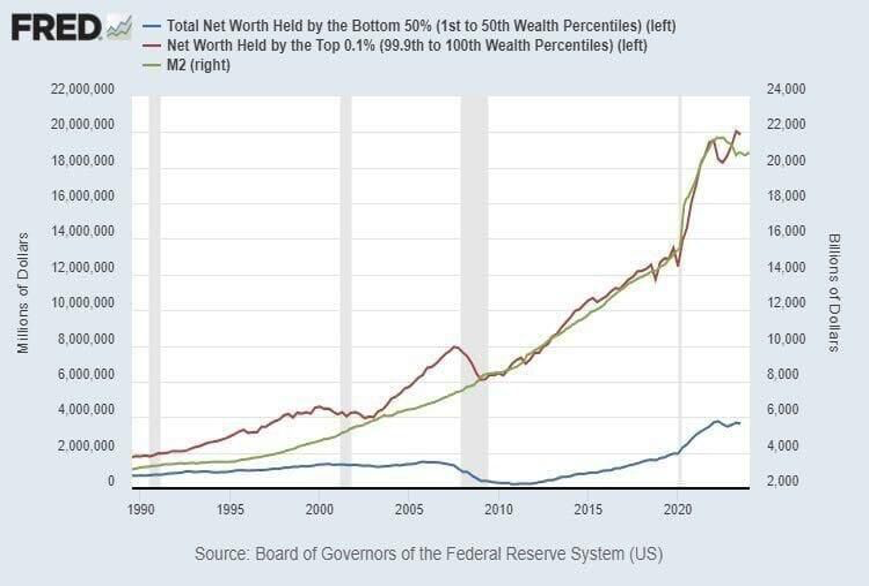
The following chart shows how the top 0.1%(green line) benefit the most from increasing money supply (red line) while the bottom 50% receive very little benefit.
- The wealthy tend to be asset rich and the impact of rising costs make up a much smaller percentage of their wages.
- Inflation hits the poorest in the economy hardest.
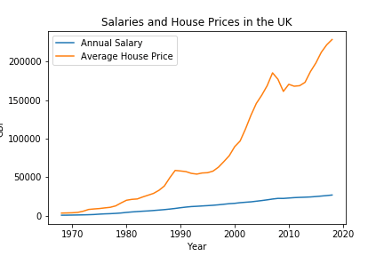
Why was it so much easier for prior generations to afford housing in the UK?
Real asset prices rise faster than wages during periods of sustained inflation driven by the increases in money supply. House prices are seen as an investment which protects wealth against inflation. Thus we see the richest investing their extra money into property over time which has caused House prices in the UK to outpace the overall rate of inflation.
The cost of housing as a proportion of incomes 50 years ago was much lower. Thus over time owning homes has become much more difficult.
What are the implications of high inflation on people:
Purchasing power reduction and inflation acts as a stealth tax on people. The average person saves most money in their bank and thus their savings are devalued over time. The wealthy have been invested in real assets which have grown faster than the rate of inflation and money supply.
Inflation has therefore contributed to the rising wealth inequality.
Go back to our first point if you had kept £100 in your bank account since 2010 you would have earned perhaps £12 in interest but you would need £169 today to maintain your purchasing power!
Many countries have grappled with high inflation—and in some cases hyperinflation, 1,000 percent or more a year. In 2008, Zimbabwe experienced an estimated annual inflation at one point of 500 billion percent.
Such high levels of inflation have been disastrous, and countries have had to take difficult and painful policy measures to bring inflation back to reasonable levels, sometimes by giving up their national currency, as Zimbabwe has. The population left holding local currency and no real assets will experience a total destruction of wealth.
Living in developed countries we have not faced such economic turbulence in recent history and find it hard to relate to the impact super high inflation has on a population.
How do I protect myself?
- History teaches us that inflation is likely to continue for the foreseeable future, at best at the rate of 2% the target of the Bank of England.
- Investments and holding assets outside of cash can help to protect against inflation. Concepts we will discuss further in RIZQ Revolution. A few examples of assets which protect us against inflation.
- Equities (Pensions and ISAs)
- Gold
- Real Estate
- Bitcoin?
Disclaimers:
The contents of this presentation should not be considered to be legal, tax, investment or other advice, and any investor or prospective investor considering the purchase or disposal of any investment should consult with its own counsel and advisers as to all legal, tax, regulatory, financial and related matters concerning an investment in or a disposal of such investment and as to their suitability for such investor or prospective investor.
For further information please talk to an authorised and regulated independent financial advisor.
Member discussion